NOS SERVICES
Data Visualization: Why data visualization is important for any career?
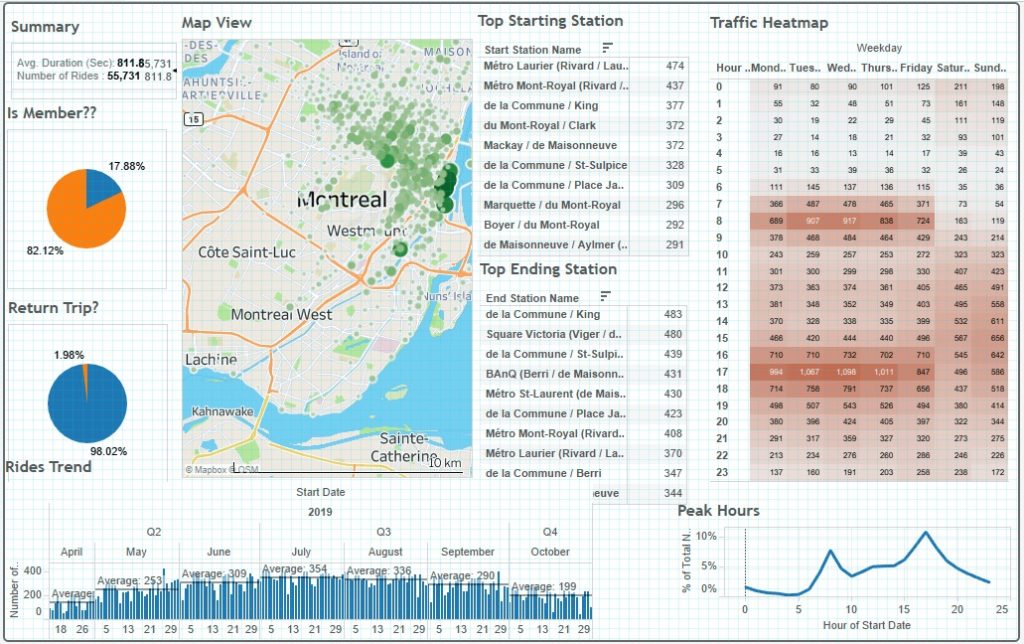
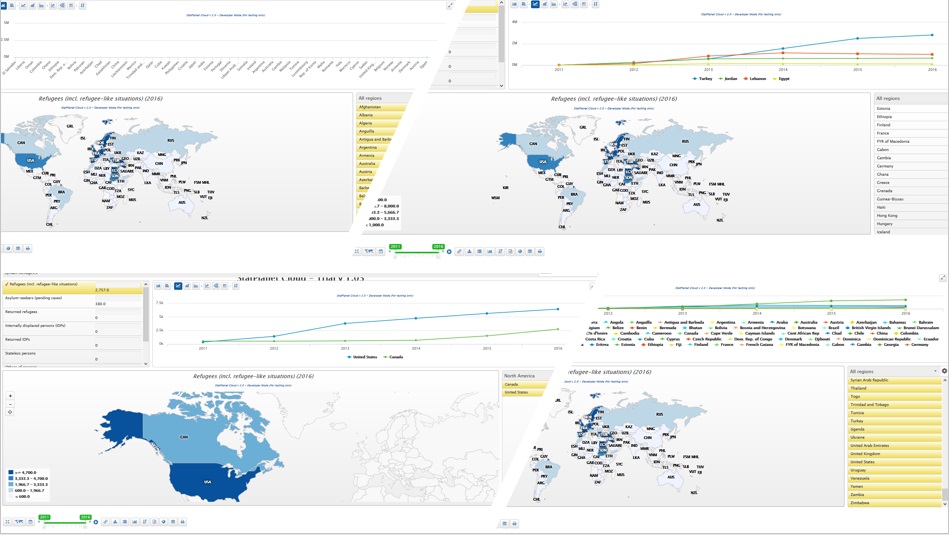
It’s hard to think of a professional industry that doesn’t benefit from making data more understandable. Data visualization is the representation of data or information in a graph, chart, or other visual format. It communicates relationships of the data with images. This is important because it allows trends and patterns to be more easily seen. With the rise of big data upon us, we need to be able to interpret increasingly larger batches of data. Machine learning makes it easier to conduct analyses such as predictive analysis, which can then serve as helpful visualizations to present. But data visualization is not only important for data scientists and data analysts, it is necessary to understand data visualization in any career. Whether you work in finance, marketing, tech, design, or anything else, you need to visualize data. That fact showcases the importance of data visualization.

Visualization gives you answers to questions you didn’t know you had.
GMH Solutions experts in data visualization consulting will help you stay on par with market changes by tailoring and upgrading visualization features as needed. We can streamline your existing data visualization platform by adding more capabilities, connecting more data sources, customizing shapes, fonts, and charts, or moving to a new technology altogether.
We go far beyond data visualization and bring businesses more data analytics capabilities. We have the skillset to set up data lakes and warehouses, provide big data consulting, engineer ETLs, and enable predictive analytics for your data-centric solution.

WHAT YOU GET FROM VISUALIZING YOUR DATA
To help you create genuinely insightful reports, we connect only relevant data worth focusing on. We carefully choose data visualization types and elements, consulting with your project stakeholders and end users—in our solutions, consistency and comprehensiveness are the priorities.
Our data visualization solutions will help you determine both existing bottlenecks and upcoming challenges. With this awareness, you will get ready to take preemptive actions.
As an established data visualization company, we can unfold your platform’s potential with custom what-if algorithms. With them, you can visualize your data to peek into your business future and get fact-backed predictions in response.